
How to Create Professional PDF Documents with Tables and Charts Online
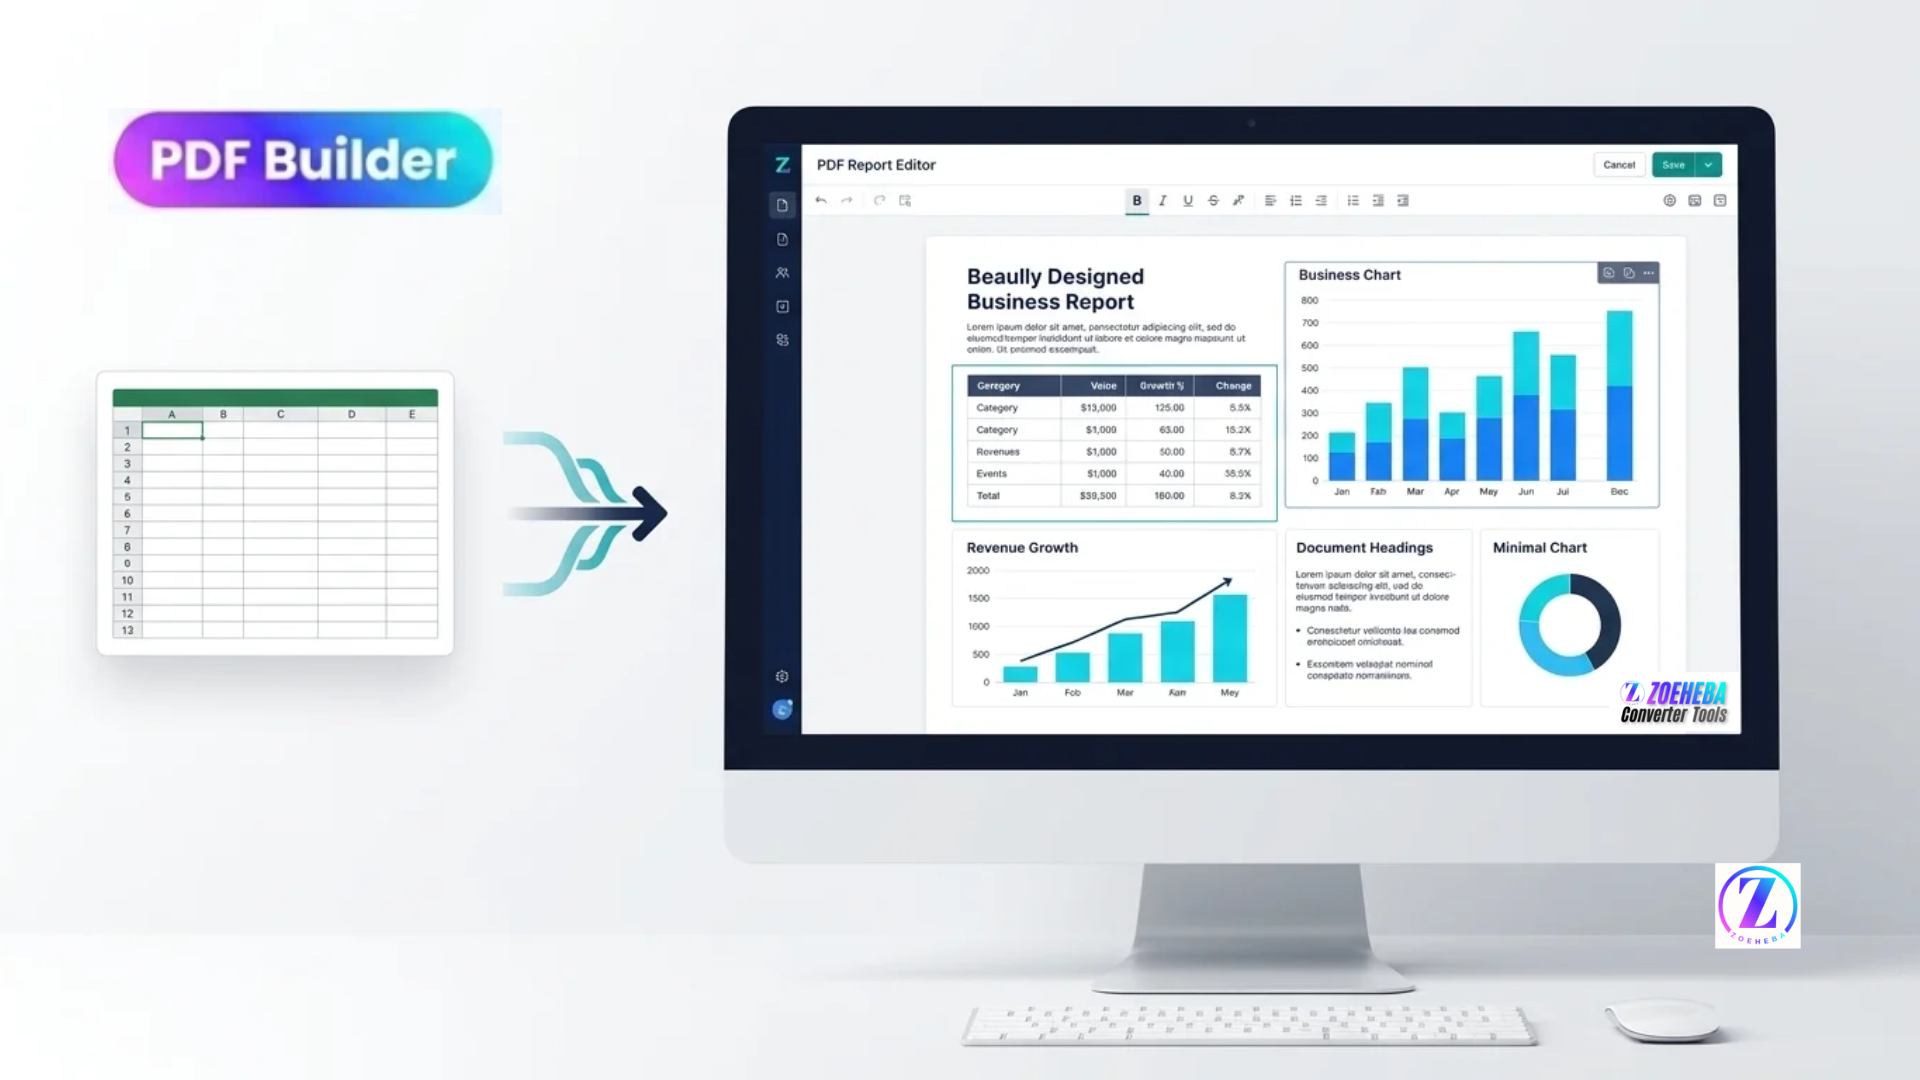
PDF documents are widely used for business reports, project summaries, financial statements, invoices, and professional presentations.
However, creating a well-structured PDF document is not always easy. Adding text is simple, but organizing tables, displaying data through charts, and maintaining a consistent layout can take additional effort.
For developers, freelancers, and business users, an online PDF builder can make this process more convenient.
In this article, we will explore how to create professional PDF documents using text, tables, charts, images, and customizable layouts.
Why Do Tables and Charts Matter in PDF Documents?
Tables and charts help transform large amounts of information into something easier to understand.
For example, imagine you are preparing a monthly business report.
You might need:
- A table showing monthly sales.
- A bar chart comparing product performance.
- A line chart showing revenue growth.
- A pie chart representing expense distribution.
Presenting everything as plain text can make a report difficult to read.
Tables organize structured information, while charts help readers understand patterns and comparisons quickly.
1. Organize Your PDF Document Layout
Before adding content, plan the document structure.
A simple business report might contain:
- Report title and introduction
- Summary of important information
- Data table
- Charts and visual comparisons
- Conclusion
Use clear headings and sufficient spacing between sections.
A consistent layout makes the final document easier to read.
2. Add Tables to Your PDF
Tables are useful when you need to display structured data.
For example, a monthly sales report could contain:
| Month | Product Sales | Revenue |
|---|---|---|
| January | 120 | $2,400 |
| February | 150 | $3,000 |
| March | 180 | $3,600 |
| April | 210 | $4,200 |
A well-designed table should have:
- Clear column headings
- Consistent alignment
- Readable text
- Proper spacing
- Meaningful data
Avoid overcrowding tables with unnecessary information.
3. Visualize Data with Charts
Charts make reports more informative.
Different chart types are useful for different purposes.
Bar Chart: Useful for comparing values across categories, such as monthly sales or product performance.
Line Chart: Useful for showing changes over time, such as revenue growth.
Pie Chart: Useful for displaying proportions, such as expense distribution.
Donut Chart: A circular alternative to a pie chart that can work well for simple category breakdowns.
Choose a chart based on the type of data you want to communicate.
4. Import Data from Excel or CSV
When working with larger datasets, entering every value manually can be inefficient.
If your PDF editor supports spreadsheet imports, you can use Excel or CSV data as the source for charts.
A typical workflow is:
- Prepare your data in Excel or CSV format.
- Organize the column headings and values.
- Import the data into the editor.
- Select the appropriate chart type.
- Review the chart and adjust its appearance.
- Add it to your PDF document.
Always check imported data before exporting the final report.
5. Add Text, Images, and Other Elements
A professional PDF often contains more than tables and charts.
You may also need:
- Titles and subtitles
- Paragraphs and descriptions
- Business logos
- Images and icons
- Shapes and visual separators
- Page numbers and section headings
Arrange these elements carefully to maintain a consistent design.
The goal is to make the document informative without making it visually crowded.
6. Export and Review Your PDF
Once the document is complete, export it as a PDF.
Before sharing it, check:
- Text alignment and readability
- Table contents and column widths
- Chart labels and values
- Image quality
- Page spacing
- Missing or overlapping elements
Open the exported PDF and review every page.
This final step is important because the exported document should look as expected, not just the editor preview.
Try Creating PDFs with Zoeheba PDF Builder
If you want to create custom PDF documents online, you can explore Zoeheba PDF Builder.
It provides a browser-based document editor with features for designing multi-page PDF documents.
Some of its available features include:
- Adding and editing text elements
- Inserting images, shapes, and logos
- Creating tables
- Adding bar, line, pie, donut, and stacked bar charts
- Importing Excel or CSV data for charts
- Managing multiple pages and document elements
- Exporting completed designs as PDFs
You can use these features to create reports, invoices, resumes, and other professional documents.
The editor is particularly useful when you need control over the document layout rather than relying entirely on a fixed template.
Final Thoughts
Creating professional PDF documents requires more than adding text to a page.
Tables help organize information, charts make data easier to understand, and a consistent layout improves the overall reading experience.
With the right PDF editor, you can combine these elements into a single document and export it for sharing or professional use.
Explore Zoeheba PDF Builder to create customized PDF documents online.
Comments
Join the discussionNo comments yet. Be the first to comment.